How to Measure Business Process Improvement: The Executive Reference Guide (2026)
By CJ Marshall, President & Founder
Evaluate how to measure business process improvement through throughput, cycle times, and operational variance to link execution directly to margin growth.

Article by
Chelvis “CJ” Marshall
Chelvis “CJ” Marshall is President & Founder of Marshall Solutions Group, a management consulting firm specializing in Strategy & Operations, Organizational Leadership & Change, and Program & Project Management. A retired U.S. Navy Senior Chief who advanced from E-1 to E-8 in 10 years, CJ transitioned into Fortune 500 enterprise leadership, where his commercial experience has included more than $20 million in contract value. He brings operator-level experience leading teams, complex programs, and mission-critical operations. His work focuses on bridging leadership and execution—helping organizations translate strategic direction into disciplined execution, stronger accountability, and measurable business results.
Completing an operational overhaul means nothing if your operating margins remain flat. When leadership teams evaluate how to measure business process improvement, they often track completed task checklists instead of velocity and cash impact. You already know the frustration of standard operating procedures that live on paper while turnaround times stall and frontline compliance falters. Measuring activity creates an illusion of progress, but it doesn't protect profitability.
This reference guide delivers the operational metrics and governance rhythms required to turn process changes into measurable margin expansion. You'll review a clear set of leading throughput indicators, a repeatable framework for isolating root causes, and the management cadence required to link daily execution directly to EBITDA.
Key Takeaways
- Evaluating operational gains requires shifting from task completion to throughput; understanding how to measure business process improvement starts by baselining cycle times, rework rates, and unit labor costs.
- End-to-end value stream mapping exposes hidden friction across functional handoffs, establishing the pre-intervention data needed to confirm real progress.
- Systematic variance tracking isolates execution delays against standard operating timelines before they erode project profitability.
- Process gains only stick when tied to a weekly management operating cadence with single-point ownership for every core performance metric.
Table of Contents
Core Metrics for Evaluating Business Process Improvement
Activity is not progress. Most operational dashboards reward administrative motion, such as tickets closed or meetings held, rather than realized throughput. To grasp how to measure business process improvement effectively, executives must establish hard baselines before launching change initiatives. You need clear historical benchmarks for total cycle time, scrap or rework frequency, and unit labor costs. Tracking process velocity, the actual rate at which raw inputs convert into delivered customer value, exposes hidden friction that task logs ignore.
Review this breakdown to see how operational variables translate directly into organizational performance:
Within formal Business process management (BPM), measurement models fall short when they prioritize statistical purity over commercial outcomes. Theoretical defect rates mean little if inventory stagnates and payroll swells.
Connecting Operational Baselines to Financial Margin
Process latency ties up working capital. When cycle times drop, holding costs decrease and capacity expands without additional head count. Leaders should track first-pass yield, the percentage of deliverables completed accurately without rework, to prevent gross margin erosion. For mid-market leadership teams seeking deep visibility, an Operational Performance Assessment pinpoints where broken handoffs trigger compounding overhead expenses. Calculating how to measure business process improvement through balance sheet mechanics ensures every operational tweak preserves profitability.
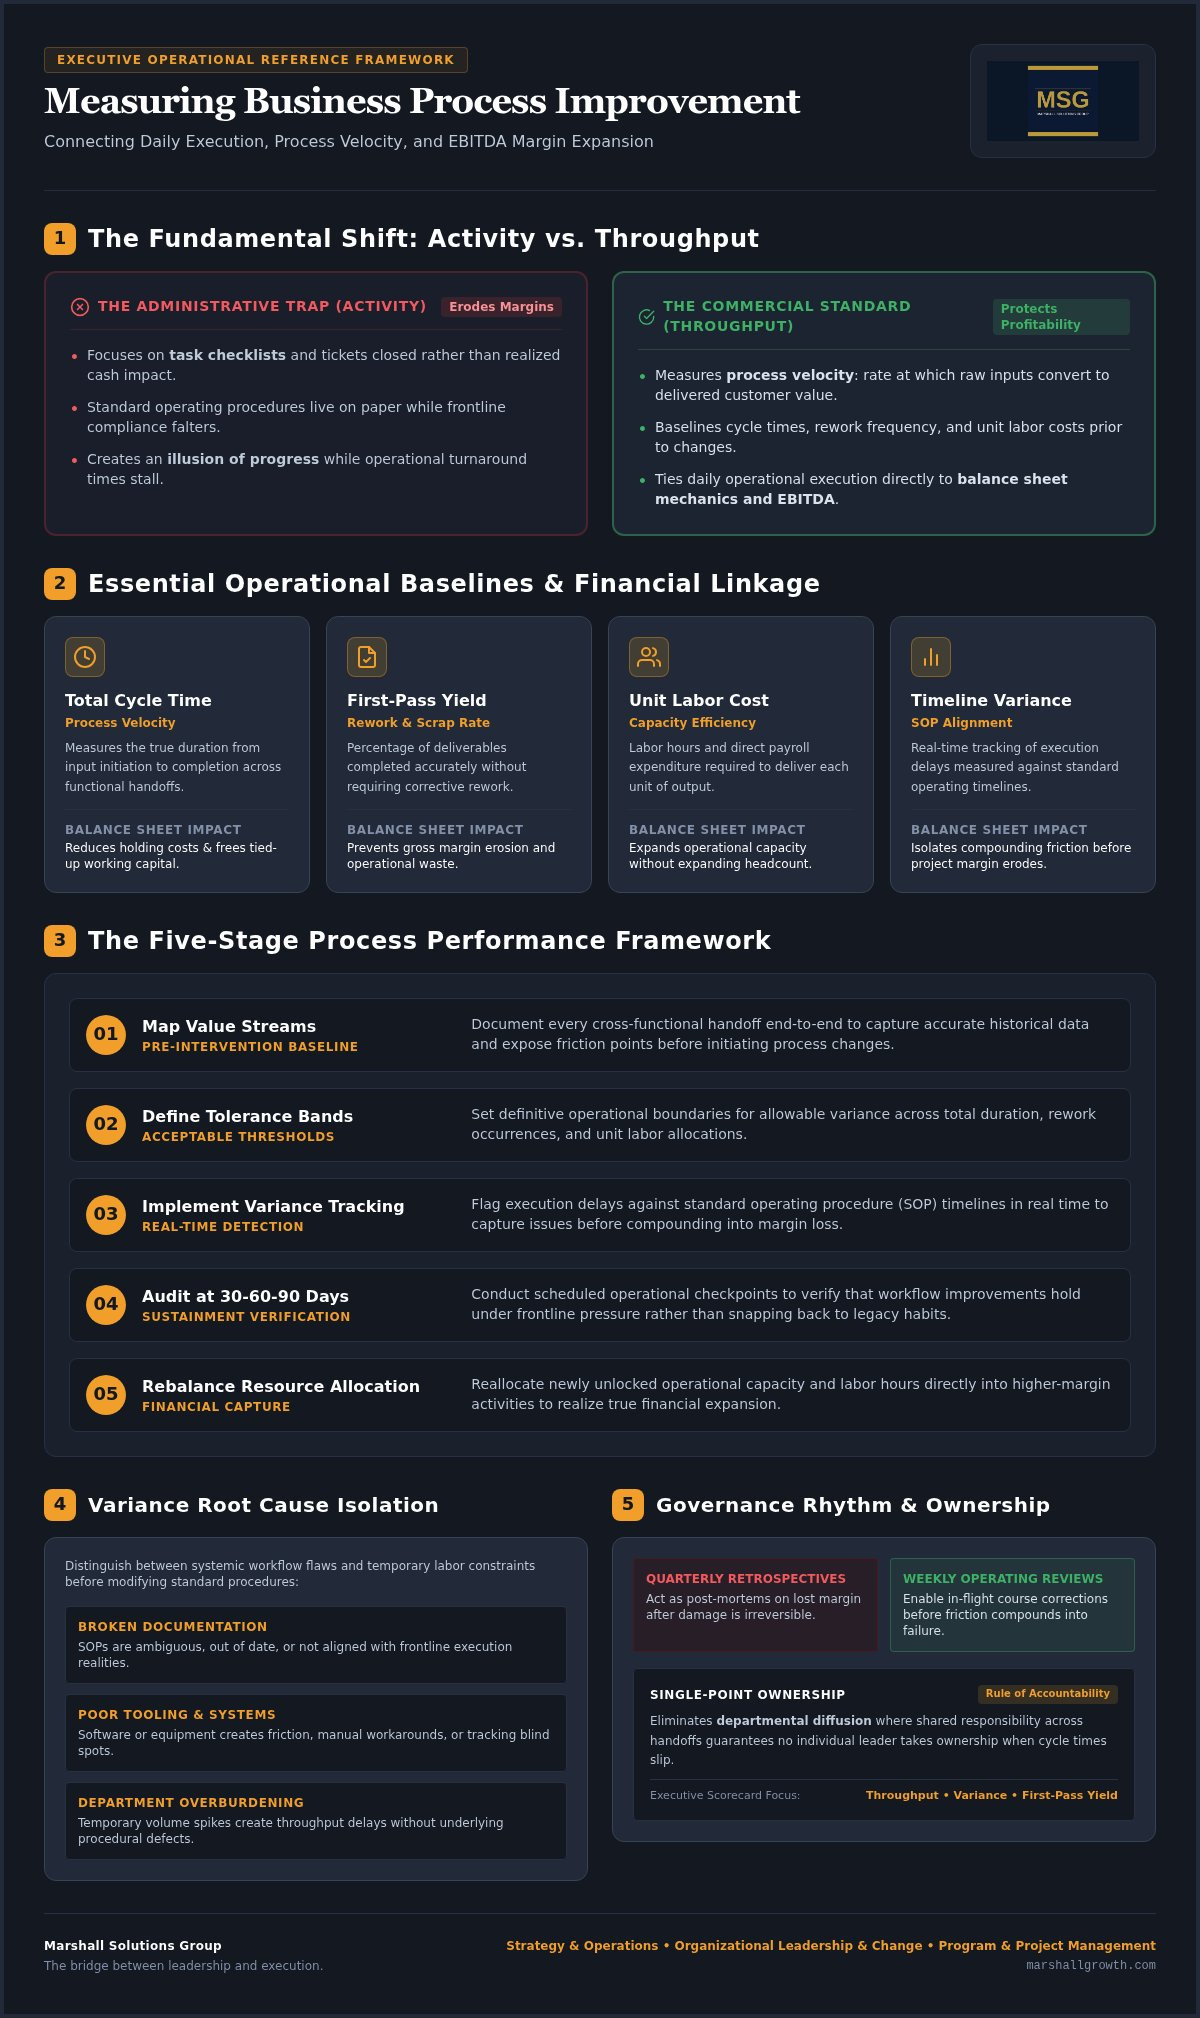
A Five-Stage Framework to Measure Process Performance
Software dashboards don't fix broken workflows. Relying on automated reports without structured governance creates an illusion of control. Knowing how to measure business process improvement requires a disciplined operational framework:
- Map Value Streams: Document every cross-functional handoff to capture pre-intervention baselines.
- Define Tolerance Bands: Set acceptable variance thresholds for duration, rework, and labor allocation.
- Implement Variance Tracking: Flag execution delays against standard operating procedure timelines in real time.
- Audit at 30-60-90 Days: Verify that operational gains hold under frontline pressure rather than snapping back to old habits.
- Rebalance Resource Allocation: Reallocate unlocked capacity into higher-margin activities to capture financial value.
If you need an embedded partner to install rigorous operational governance across complex value streams, explore how our Strategy & Operations Consulting bridges the gap between executive strategy and frontline execution.
Isolating Root Causes Behind Metric Variances
When variance data flags an operational delay, leaders often jump to conclusions. You must distinguish between systemic workflow flaws and temporary labor constraints before modifying procedures. Deploying structured root cause analysis techniques ensures you treat the underlying friction rather than the frontline symptom. Mastering how to measure business process improvement means knowing when a missed target stems from broken documentation, poor tooling, or simple department overburdening.
Establishing the Management Cadence to Sustain Process Gains
Digital checklists don't guarantee process compliance. Software alone cannot force frontline adherence when operational pressures mount. Without a structured operating cadence, revised workflows quickly dissolve back into legacy habits. Sustaining gains requires shifting from quarterly retrospectives to weekly operational reviews. Quarterly meetings act as post-mortems on lost margin, whereas weekly rhythms allow leaders to make in-flight course corrections before small delays compound into delivery failures.
Every critical process KPI demands single-point ownership. Departmental diffusion occurs when multiple teams share responsibility for a handoff, ensuring that no single leader takes accountability when cycle times slip. Executive scorecards should eliminate clutter by displaying only throughput, variance, and first-pass yield. When visual indicators clearly highlight friction points, teams focus on fixing bottlenecks rather than debating conflicting data sets.
Aligning Leadership Accountability with Operational Reporting
Anchoring measurement within a disciplined Operational Excellence Framework connects frontline throughput directly to strategic business outcomes. This operational alignment removes departmental silos and demands absolute clarity around performance expectations. Mastering how to measure business process improvement requires treating process governance as an active leadership discipline rather than an administrative checklist. When internal capacity limits your ability to drive structural change, Marshall Solutions Group embeds experienced operators directly into leadership teams to execute transformations and secure enduring margin improvements.
Transform Process Baselines Into Bottom-Line Results
Operational change demands moving past activity tracking to evaluate true throughput velocity, eliminate scrap and rework, and maintain weekly review rhythms anchored by single-point ownership. Knowing how to measure business process improvement with precision ensures standard operating procedures cease being static documentation and start actively protecting your bottom line.
Securing lasting margins requires relentless operational discipline. Backed by 60+ years of combined military command and enterprise operations experience, our embedded delivery model works directly alongside your leadership team to turn frontline execution into scalable financial performance. Schedule an Operational Assessment with Marshall Solutions Group to eliminate hidden friction and build the disciplined operational momentum your business needs to thrive.
Frequently Asked Questions
How do you measure business process improvement without slowing down daily operations?
Track passive operational telemetry rather than forcing staff to fill out manual logs. Extract milestone timestamps directly from existing enterprise software and project management tools. When evaluating how to measure business process improvement, focus on three vital checkpoints across the value stream: project kickoff, cross-department handoffs, and final client sign-off. This approach captures accurate cycle times without burdening your frontline operators.
What is the difference between leading and lagging process improvement metrics?
Leading metrics evaluate live workflow conditions to predict outcomes before work concludes. These include queue depth, daily processing velocity, and initial review error rates. Lagging metrics calculate the final financial impact after project completion, such as realized gross margin and total project duration. Leading indicators allow managers to intervene immediately, while lagging indicators verify whether process enhancements generated the intended return.
How frequently should executive leadership review operational process performance data?
Operational review rhythms belong on a weekly cadence. Monthly or quarterly meetings look backward at sunk labor costs and eroded profitability when it is too late to adjust course. A concise 30-minute weekly review focusing strictly on process variances, WIP inventory, and milestone bottlenecks keeps frontline teams accountable and lets leadership correct small operational misalignments before they compromise delivery schedules.
What are the most common mistakes companies make when measuring process improvement?
Organizations often confuse raw activity with valuable throughput. Tracking total tasks completed or meetings logged rewards administrative overhead rather than operational efficiency. Another frequent pitfall in understanding how to measure business process improvement is failing to establish firm baselines before deploying new workflows. Without clean pre-intervention data on unit labor cost and rework rates, verifying financial margin growth remains impossible.
Disclaimer
The information provided in this article is for general informational and educational purposes only and does not constitute legal, financial, accounting, engineering, or other professional advice. Marshall Solutions Group, Inc. makes no representations or warranties regarding the completeness or applicability of this information to any specific situation. Readers should consult appropriately qualified professionals before making decisions requiring specialized professional advice.